The IHD has several screens to show consumption, demand, cost, trends and other information, plus capabilities to receive customized messages from MLGW. The device has a battery and a plug-in charger, so it can be carried throughout the house, placed on a table or counter top, or hung on a wall for easy viewing. I have mine by the front door.
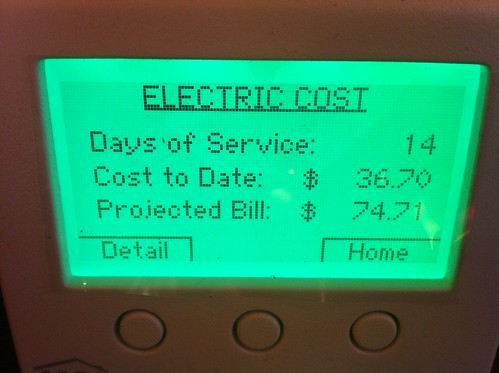
As you can see, it shows how many days of service I've had during the current billing cycle, the cost to date, and the projected monthly cost. At the time of this photo, I was pretty excited about the outlook for my June bill. However, the extremely high temps over the past few days have caused us to up our air-conditioning use. It's been interesting to watch how the temperature outside directly affects our utility bill.
Even though we've kept the air on 78, the recommended setting, the rising temps outside make it harder and harder to achieve 78 inside. When it's 85 outside, we only had to make up 7 degrees. With temps hovering around 100, we have to make up 22 degrees. That definitely adds up.
Then there's other major electricity users like the hot water tank, the washer/dryer, dishwasher, refrigerator, the TV, and computer. MLGW expanded the My Account website to include new tools that help Smart Grid Demonstration participants track electricity usage, power demand and electricity costs online. The meter information is uploaded once a day and will grow to contain two years of smart meter history for detailed analysis. With smart meter highlights and multiple graphs, participants see how their electricity usage changes throughout the day and month, providing greater information for better control over when and how electricity is used.
You can see example graphs and meter highlights here.
2 comments:
I am supposed to get one of those. Where's mine?
They are being distributed in June.
Post a Comment